


 India
India NRI
NRISeries 35: Supertrend Indicator
Feb 04, 2025
Series 35: Supertrend Indicator
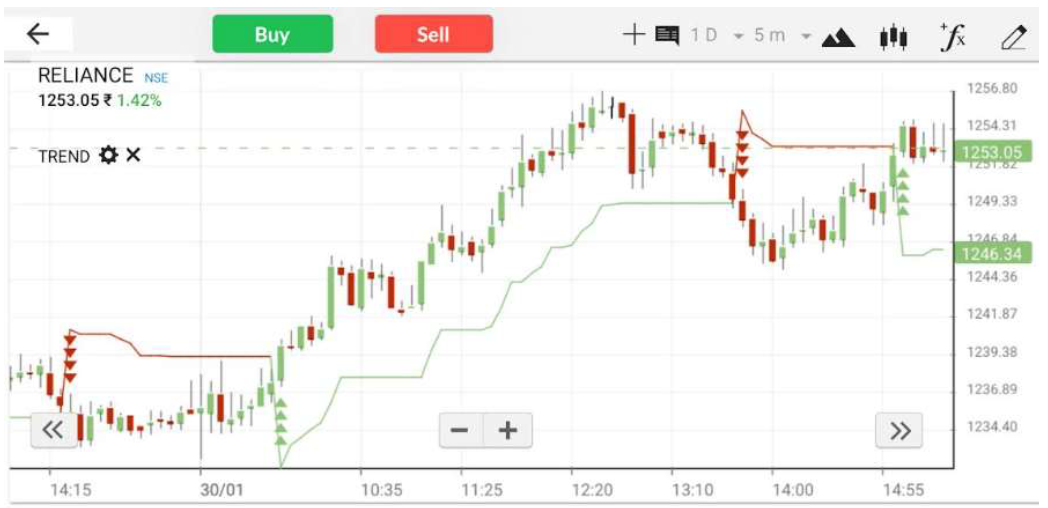
The Supertrend is a widely used tool in technical analysis, designed to identify the direction of the prevailing trend. It is plotted on a price chart and shifts above or below the price based on the current regime.
How is it calculated?
This indicator relies on two key components: the Average True Range (ATR), which measures market volatility, and a multiplier that adjusts its sensitivity. The calculation involves the following steps:
Determine the Basic Upper and Lower Bands:
Upper Band (UB):
UB = (High + Low) / 2 + (Multiplier × ATR)
Lower Band (LB):
LB = (High + Low) / 2 − (Multiplier × ATR)
Calculate the Final Bands:
-
● Final Upper Band (FUB):
If the price is below the current Upper Band (UB), take the lower value between the current UB and the previous FUB. -
● Final Lower Band (FLB):
If the price is above the current Lower Band (LB), take the higher value between the current LB and the previous FLB.
Plot the Indicator:
- ● If the price closes above the FUB, the trend is bullish, and the line is plotted below the price.
- ● If the price closes below the FLB, the trend is bearish, and the line is plotted above the price.
Example Calculation:
Assume the following data for a stock:

Step 1: Calculate the Basic Bands
Upper Band:
UB = (500 + 480) / 2 + (3 × 10) = ₹500
Lower Band:
LB = (500 + 480) / 2 − (3 × 10) = ₹470
Limitations
- ● As a trend-following indicator, it lags behind price movements and may not perform well in sideways or choppy markets.
- ● It helps traders identify the prevailing market trend and avoid trading against it.
- ● The indicator adapts to market volatility, making it effective in different market conditions.
- ● The effectiveness depends on the chosen multiplier and ATR period. A higher multiplier reduces sensitivity but delays signals, while a lower multiplier increases sensitivity but may lead to more false signals.
Disclaimer: This information is for educational purposes only. Consult a financial advisor before engaging in such trading activities.
Axis Direct Disclaimer This is for educational purposes only. Axis Direct is a brand under which Axis Securities Limited offers its. Retail broking and investment services. Investments in the securities market are subject to market risks. Read all the related documents carefully before investing. Disclaimer & Statutory Information